Ancestry-specific tagging in admixed individuals
[1]:
import admix
import os
import matplotlib.pyplot as plt
import numpy as np
Simulate admixed individuals with African-European admixed ancestries
[2]:
# specify reference data sets
dset_dir = admix.dataset.get_test_data_dir()
ref_dset = admix.io.read_dataset(os.path.join(dset_dir, "toy-all"))
ref_dset_list = [
    ref_dset[:, (ref_dset.indiv.SuperPop == pop).values] for pop in ["EUR", "AFR"]
]
[3]:
# simulate 8 generations
n_indiv = 5000

mosaic_size = admix.simulate.calculate_mosaic_size(
    ref_dset.snp, "hg38", chrom=22, n_gen=8
)

np.random.seed(1234)
dset = admix.simulate.admix_geno(
    geno_list=[dset.geno for dset in ref_dset_list],
    df_snp=ref_dset_list[0].snp,
    n_indiv=n_indiv,
    anc_props=[0.5, 0.5],
    mosaic_size=mosaic_size,
)
2025-02-13 21:52:56 [info     ] genetic_map not found at /home/runner/work/admix-kit/admix-kit/admix/../.admix_cache/data/genetic_map/genetic_map_hg38_withX.txt.gz.
2025-02-13 21:52:56 [info     ] Downloading genetic_map from https://storage.googleapis.com/broad-alkesgroup-public/Eagle/downloads/tables/genetic_map_hg38_withX.txt.gz.
2025-02-13 21:52:56 [info     ] If this gets stuck or fails, manually download https://storage.googleapis.com/broad-alkesgroup-public/Eagle/downloads/tables/genetic_map_hg38_withX.txt.gz to /home/runner/work/admix-kit/admix-kit/admix/../.admix_cache/data/genetic_map/genetic_map_hg38_withX.txt.gz.
100%|██████████| 10000/10000 [00:00<00:00, 38155.88it/s]
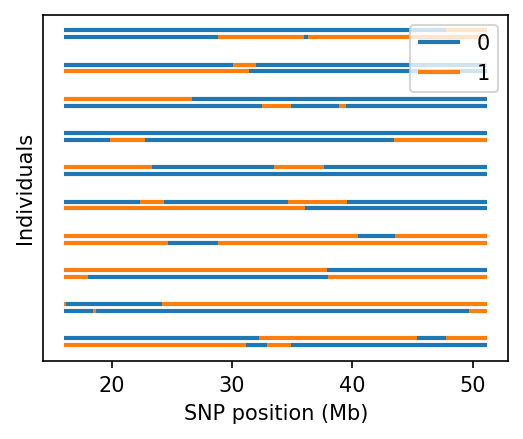
[4]:
fig, ax = plt.subplots(figsize=(4, 3), dpi=150)
admix.plot.lanc(dset, ax=ax)
/home/runner/work/admix-kit/admix-kit/admix/plot/_plot.py:345: UserWarning: Only the first 10 are plotted. To plot more individuals, increase `max_indiv`
  warnings.warn(

[5]:
dset.snp[["EUR_FREQ", "AFR_FREQ"]] = dset.af_per_anc()
admix.data.af_per_anc: 100%|██████████| 1/1 [00:00<00:00, 2.28it/s]
[6]:
dset = dset[
    (
        (dset.snp.EUR_FREQ.between(0.01, 0.99))
        & (dset.snp.AFR_FREQ.between(0.01, 0.99))
    ).values
]
display(dset)
admix.Dataset object with n_snp x n_indiv = 1091 x 5000, n_anc=2
        snp: 'CHROM', 'POS', 'REF', 'ALT', 'EUR_FREQ', 'AFR_FREQ'
Math expression for ancestry-specific tagging
We first assume the phenotype has a single causal variant \(s\), and phenotype can be modeled as
where \(\mathbf{g}_{s,\cdot}\) denote the genotype for each local ancestry, and \(\boldsymbol{\beta}_{s,\cdot}\) denote the allelic effect sizes for each local ancestry. The above equation can be rewritten for notation convenience, as
where we denote
and
Now we consider another tagging variant \(t\), we ask what would be the ancestry-specific marginal effects evaluated at the tagging variant \(t\) if the causal effects are the same across ancestries at variant \(s\)?
Based on linear regression, the estimated effects at \(t\) are
And the expectation of estimated effects are
Because by assumption, \(\boldsymbol{\beta}_{s,1} = \boldsymbol{\beta}_{s,2} = \beta_s\), the above expectation can be simplified as
Therefore, \((\mathbf{G}_t^\top \mathbf{G}_t)^{-1} \mathbf{G}_t^\top \mathbf{g}_s\) is the key quantity here.
Implementation
The following code admix_tagging calculate this quantity
[7]:
def admix_tagging(admix_ld, s: int, t: int):
    """
    Assuming the causal SNP s, calculate the tagging from SNP s to SNP t

    Parameters
    ----------
    admix_ld: Dict
        calculated by admix.data.admix_ld
    s: int
        source SNP
    t: int
        target SNP
    """

    def GG(admix_ld, s, t):
        ld1, ld2, ld12 = admix_ld["11"], admix_ld["22"], admix_ld["12"]
        return np.array([[ld1[s, t], ld12[s, t]], [ld12[t, s], ld2[s, t]]])

    GtGt = GG(admix_ld, t, t)
    GtGs = GG(admix_ld, t, s)
    tag = np.linalg.inv(GtGt) @ GtGs @ np.ones(2)[:, None]
    return tag.flatten()
[8]:
print(admix.data.admix_ld.__doc__)
Calculate ancestry specific LD matrices

    Parameters
    ----------
    dset: admix.Dataset
        dataset containing geno, lanc
    cov : Optional[np.ndarray]
        (n_indiv, n_cov) covariates of the genotypes, an all `1` intercept covariate will always be added
        so there is no need to add the intercept in covariates.
    Returns
    -------
    K1: np.ndarray
        ancestry specific LD matrix for the 1st ancestry
    K2: np.ndarray
        ancestry specific LD matrix for the 2nd ancestry
    K12: np.ndarray
        ancestry specific LD matrix for cross term of the 1st and 2nd ancestry
[9]:
# precompute once
# you can optionally control for some covariates
admix_ld = admix.data.admix_ld(dset, cov=None)
[10]:
# causal SNP 1, tagging SNP 0
admix_tagging(admix_ld, s=1, t=0)
[10]:
array([ 0.25264469, -0.08786723])
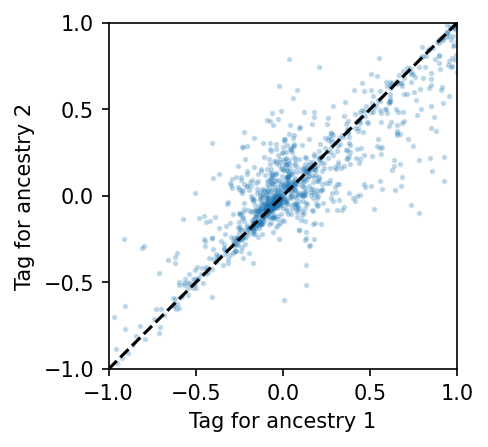
Now we calculate the ancestry-specific taggability for every target SNP \(i\) from potential causal SNP \(i + 1\).
[11]:
res = []
for i in range(dset.n_snp - 1):
    res.append(admix_tagging(admix_ld, s=i, t=i + 1))
res = np.vstack(res)
[12]:
fig, ax = plt.subplots(figsize=(3, 3), dpi=150)
ax.scatter(res[:, 0], res[:, 1], s=3, alpha=0.2)
lim = max(abs(res.max()), abs(res.min()))
ax.set_xlim(-lim, lim)
ax.set_ylim(-lim, lim)
ax.plot((-lim, lim), (-lim, lim), "k--")
ax.set_xlabel("Tag for ancestry 1")
ax.set_ylabel("Tag for ancestry 2")
[12]:
Text(0, 0.5, 'Tag for ancestry 2')
